Ian's Bits & Bobs: The Blog

Screenshot 2019-11-04 11.13.18 Screenshot 2019-11-04 10.47.31

5 “hmmms” from 5 Numbers!

As some readers may know, we launched our new online project (The 5 Numbers Project at Your MarketMetrics) to build a national database for independent garden retailers this year, and have been amazed at the response in just a few months. We already have 56 garden center companies (and counting!), representing total retail sales of more than $330 million reporting their five monthly metrics. (Enrollment window is open now so new participants still have time to enter their historical data before spring 2020 hits!)

The detailed resulting trends data is only available for participating companies, but … to pique your interest, we CAN share some observations that might just make you go “Hmmm…”. We know that just a few months’ data doesn’t make a national take-it-to-your-loan-officer trend, but we can still point to a few aspects of the industry that you might like to chew on with your team!

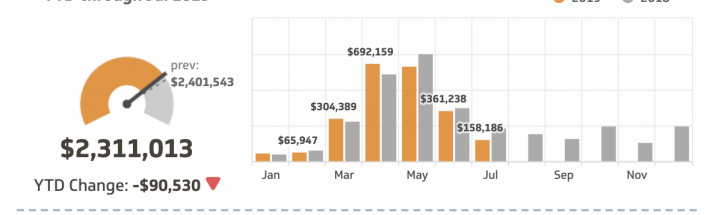
Hmmm #1.  Most regions of the country had a decent year according to Sales $s or “topline” … but is that topline growing faster than the total costs of being in business – i.e. the cost of just opening the door every day? Do you know your daily cost of being in business and are your sales rising faster?  Hmmm…

Hmmm… #2.  Customer Count (register rings/tickets) has increased for most GCs in 2019, but did yours rise a) faster than sales or b) slower than sales? The remedy for a) is very different to the one for b) and it’s very hard to attack both at once! Which is your priority? Do you have the resources to address it for 2020?  Hmmm…

Hmmm… #3. Average Sale Per Customer (including increased retail prices) is NOT keeping up with consumer spending, despite full employment and rising personal debt. Ultimately, we’re losing “wallet share”. Many GCs are selling LESS units or products, are you? If so, are your Gross Margin $s increasing fast enough to compensate? Hmmm…

Hmmm… #4. Growth in Gross Margin $s is a mixed bag this year; GM “leakage” is a thing! If GM$s decrease, can you cut other costs accordingly? Good luck with that! Inventory and labor take 65% to 75% of Sales $s, so what really matters is what’s left after you’ve bought your stuff and paid your people – what we call “Gap $s” (Gross Margin after Labor). If your Gap $s are less than last year, you’re going backwards, I don’t care what the topline sales tell you! Hmmm…

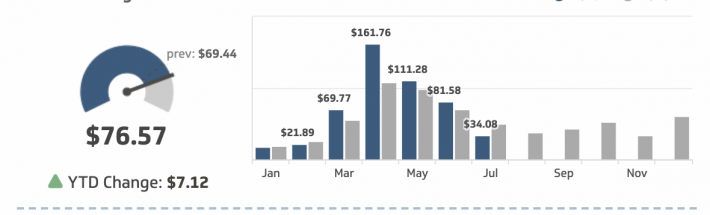
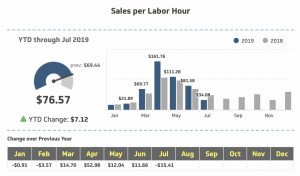
Hmmm… #5. The “Secret Sauce” in The 5 Numbers Project is measuring Labor Hours as well as Labor $s so we can track trends in your Labor Productivity, and the range is HUGE. Some GCs are twice as productive as their neighbors! What is a “GREAT” productivity number? How does yours compare? Is your Labor Productivity rising faster than the cost of Labor? It better be! Hmmm…

We’ve been using these metrics for over 20 years with clients, but it always amazes me how many crucial business decisions and follow-up strategies can be arrived at from just 5 monthly numbers: Sales $s, Customer Count, G Margin $s, Labor $s and Labor Hours.

Would you like to join us, making 2020 the year that you focus on improving your business’ productivity and profitability? The 5 Numbers Project (T5NP) allows you to see in simple-at-a-glance charts how your business is doing monthly and YTD and then compares your performance with your anonymous industry peers both by region and company size. These simple visuals empower your TEAM to make improvements and really “move the needle” as you measure what matters. Many of the GC industry’s “A List” are already onboard, and we’d love you to you join us for the T5NP journey!

(** The fine print: You can learn more about pricing at the T5NP link, but onboarding is a one-time fee of $895 to get your own personal dashboards built (and $149/month thereafter.) We also have some partnerships with buying co-ops, like Master Nursery Garden Centers, that can get you some price discounts!)

Nov 4, 2019 2 Comments
2018-07-31 09.13.33

Before You Spend It All at the Next Trade Show….

Ah, ‘tis the season of trade shows, long days, hotel food
and spending your hard-won money from 2018 on inventory for 2019. But sometimes
that need to fill the shelves and tables can cloud your judgement … I recall a
client who just assumed that he and his buyers would spend $250K at a few
winter trade shows and then agonized over a $25K parking upgrade for years!

Just sweat the big
stuff!

Don’t get me wrong, inventory is the ONLY investment that
actually creates cash, everything else from wages to facilities just support
that investment. But the fact is that 70%-80% (hope it’s not that high!) of all
the sales dollars goes out within weeks or months on just two items. Inventory
and labor. So that’s where we start.

Asking the right questions

What didn’t sell last year despite the fact that we all
loved it? Which SKU can we do without? Which category had the worst Gross
Margin? Is that supplier the really on our side? Do we have information on
which to negotiate? Which items took up too much space to justify the margin
dollars? That new product looks great… but what’s the labor cost to set it up? Do
we have the skill set to make money in that category?

For years we have been asking these questions to clients and helping them come up with answers driven by real hard, cold facts and figures, rather than emotions. These facts and figures come from just 5 simple numbers we have tracked for over 12 years and this best-practice is now available to all independent garden retailers through our new “5 Numbers Project”. (Click here to see some sample dashboards).

The numbers to drive
your numbers!

It’s easy-peasy. Simply submit these five numbers each month
online and see the comparisons both in-house with your same stats last year AND
compare trends (totally anonymously) with your peers across the country. No
extra days in the office or hours on your tablet, no expensive accountancy or
extra software, just 5 numbers and you’re done.

Subscriptions for first round of The 5 Numbers Project – to compare with other retailers (anonymously) across the US are available ONLY until Monday January 7 … so it’s time to ACT NOW!  For the price of a few racks of perennials or a couple of pallets of fertilizer, we will give you critical profitability and productivity information personalized to YOUR business. “Measuring What Matters” and comparing with others might be your best January investment, but you need to click here to subscribe today!

Jan 4, 2019 Comments Off on Before You Spend It All at the Next Trade Show….
t5np8Nov2018

T5NP – Subscription Deadline extended to Jan 3, 2019

Ho, ho, ho!! We’re thrilled with the uptake so far on subscriptions to The 5 Numbers Project, both in number and in caliber of companies. It’s a great mix of businesses large and small from all across the country.

We’ve heard from some of our favorite elves out there that this season has been so busy … that you’re only just now having a moment to breathe and focus on the coming year. While our original (today) December 23 deadline for new subscriptions to The 5 Numbers Project was set up so you wouldn’t have to think about it over the holiday, it turns out some of you really LIKE using the quiet weeks after Christmas to think about ‘big picture’ things like this! So by popular request, as a gift to ALL OF YOU who have made the holiday so merry for others this year, we’re happy to extend the subscription deadline until January 3, 2019.

(Early January is important though, so we can get all new subscribers onboarded and your personal dashboards built so you can effectively be tracking by the time first numbers are due in – Feb 15-21, 2019).

So if you haven’t yet had a moment to take a look at the SAMPLE DASHBOARDS and get yourself subscribed into the system (if you’re a GCU Alumni firm, check your email for a discount code!) – there’s still 2 weeks to make that magic happen, giving yourself the gift of BETTER PROFITABILITY in 2019!

For today, Lisa and I, together with Kellee and the entire Your MarketMetrics – 5 Numbers Project Team wish you a Merry Christmas and a wonderful end of 2018! We are excited to launch this landmark industry benchmarking initiative with all of you in 2019.

Dec 23, 2018 Comments Off on T5NP – Subscription Deadline extended to Jan 3, 2019
t5np14Nov2018

T5NP*: Fourth Number – Labor Dollars

Between 65% and 80% of all the money that independent garden retailers receive as Sales Dollars is spent within the next few weeks or months on just two aspects of running the business: Inventory and Labor.  So yes: Labor Dollars is a BIG important number!

The range of labor costs as a percentage of sales in all types of retail can range from the low single digits of a warehouse “club” to the high 20%s, even the low 30%s in a lavishly, full service, up-scale store (the sort of place you have to ask them to let you in…). The range in a typical independent or local garden retailer can be from 15% of sales to the high 20s, depending on the service model and the competency of the management.

A Burden Or An Investment?

But as you’ve heard me say, dollars pay the bills, not percentages, so let’s look at what that means in real numbers. When we talk about the labor bill (and when we track it in the 5 Numbers Project), we are taking about the whole cost of labor, not just the wage the employee gets. The “human” costs of employing others (sometimes called “Burden”) are unknown to many employees. Well, unless someone told them, how would they know anyway? I didn’t when I was an employee.

This labor total includes the actual wage plus all payroll taxes and fees, plus the employer’s contributions to things like FICA, FUTA, Workman’s Comp, Health Insurance, Vacation Pay or PTO, training, conference travel and even uniforms. If it is part of having human beings working at your company, we include it. Depending on what state you operate in, this can add up to 30% or more to the hourly cost, making a $15 an hour employee cost the company more like $20. I just heard from a client this week that their health insurance alone now works out at an extra $3.50 an hour (but their poinsettia prices haven’t gone up in years…)

So the rise in labor dollars is something we are closely following, especially in a good economy when employees have some leverage to bargain with. Just from watching the trends of this one number, questions emerge: Is our rise in labor dollars more or less than our rise in what pays for it, i.e., Sales Dollars? Are Gross Margin dollars going up quicker than Labor Dollars and if not, how do we make that happen?

Making Informed Decisions

When Labor Dollars are a focus of management, buyers who discover that next “killer” item, can now ask themselves if the extra labor cost associated with this new product will negate all the extra margin dollars it could bring in. That’s a “hmmm…” factor. (It might also be a good negotiating point with the supplier!)

When you closely track your labor costs, it almost becomes second nature to think of the value of the task the team are currently doing. Are we matching employee costs to the value of the task? Do we have employees costing $24 an hour doing tasks that could be done by someone costing less, and if so – is there an employee growth opportunity? I know a manager who once calculated that, because of their disorganized receiving system, the labor cost of unloading a truck was about the same as the Gross Margin dollars in that load! (That’s an Arrrggghhh!)

So, as you can tell, we do watch all these numbers very closely. As Labor Dollars are the second biggest cost after Inventory (and exponentially more than the marketing budget!), we especially track the trends and changes in this one.

Click here to learn more about The 5 Numbers Project: a national initiative to create valuable benchmarking & visual dashboards that will increase profitability for independent garden centers. And stay tuned for the last of the 5 numbers – Labor Hours – next week.

Nov 14, 2018 Comments Off on T5NP*: Fourth Number – Labor Dollars
t5np21Oct18

T5NP*: Second Number – Customer Count

(We say “Customer Count”- aka Register Rings, Tickets, Baskets or Checkouts)

I am always a little surprised at the number of owners and managers who DON’T track or even think about this metric. Surely just from a Return on Investment in marketing aspect it should be one to watch. Savvy operators are currently using this metric trend to see what effect the switch from traditional media marketing to social media marketing is having on the number of shoppers coming in the door.

The number of customers who volunteer to spend their precious time and money at your store is first and foremost a reaction to the company’s value proposition. It’s the public’s response to your marketing, promotions, reputation, drive-by appeal or their previous shopping experience. It’s the public’s “secret shopper” report – every day.

Just for starters, a history of customer count by the hour is very useful for team scheduling so you don’t have 5 employees gathered round the register at 8.00am, but only two out selling in the after-school rush at 4pm!

Context Is Necessary

Customer count is influenced by outside events or circumstances and any record of it must also have a note of the business conditions in that time period. If it rained heavily this week last year or there was a major ball game on TV that weekend last year, managers should know before they react to the number.

We are always cautious about comparing one day, week or even a months’ data in this metric so we look for trends in the customer count more than specifics. I’ve seen too many owners stress out on a couple of lower-than-expected days or weeks. The sky is probably not about to fall if customer count is down 10% in a specific spring. That’s why we will be building anonymous regional groups in The 5 Numbers Project so you can see if your customer Count IS 10% down when your local peers are all up. (Then there’s a reason for a ‘hmmmm’….!)

Interesting, But Now What?

If customer count is going down, it might mean a marketing challenge to recapture lost traffic or stimulate new shoppers to try your offer. In that case budgets should be geared to boosting external messages, marketing, image, exterior remodeling, building community relations and so on.

If customer count is going up, you may have a sales and merchandising challenge serving and inspiring all those extra people to spend while in your store. In this case, budgets should invest in more internal resources for improved hiring, training, buying, merchandising, silent selling and just generally helping customers spend more.

Just think, so many significant management decisions from one little number! (That’s another Hmmm….!)

Next week, we’ll tackle the third of The 5 Numbers as we gear up to open subscriptions in the Project (*T5NP) … stay tuned!


Oct 31, 2018 Comments Off on T5NP*: Second Number – Customer Count