Ian's Bits & Bobs: The Blog

Screenshot 2019-08-04 13.57.53 Screenshot 2019-08-13 07.56.22 Screenshot 2019-08-13 07.59.28 Screenshot 2019-08-04 13.58.32 Screenshot 2019-08-04 13.58.10 Screenshot 2019-08-04 13.57.53 Screenshot 2019-08-04 13.57.42

We’re Measuring what Matters…

and now, with 2 years of data, we can share some “hmmmmm” questions!

You may have noticed that I was offline here for a bit, while you all were off having Spring! We were working on The 5 Numbers Project (T5NP), a new national platform for anonymous online sharing and comparing of garden retail performance numbers.

In the first enrollment period (pre-Spring ’19), we had 51 GC companies in 22 states and 3 Canadian provinces, with total retail sales over $310 million, join the program. On the Grower side of the industry, Dr Charlie Hall has now been operating a similar program (with different metrics) for two years, so our retail participants can also get his key takeaways in our online “Insights Library”. Finally, the garden business is getting a national independent retail database – long overdue! This represents REAL DATA on which to make profitability comparisons, investment or borrowing decisions, goal setting or even to “sell up and relax”!

How Does it Work?

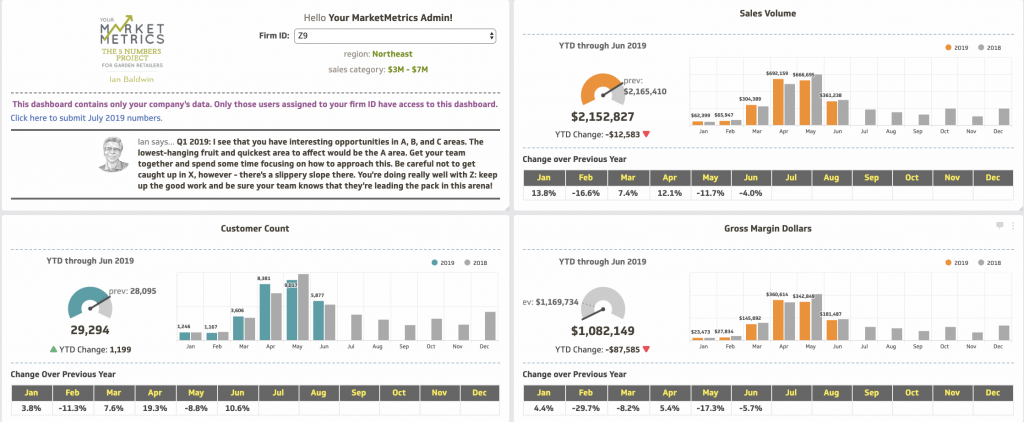
T5NP participants submit just the 5 numbers that matter, every month, through a secure online portal and the “magic software” does the rest. It’s almost two programs in one: At any time GC owners and key team players such as managers or buyers can view the company’s own Private dashboard comparing this year’s profitability performance with last year’s. Secondly they can use the group Comparison or Trend dashboards to see how their business is trending YTD or through all last year with the other GCs.

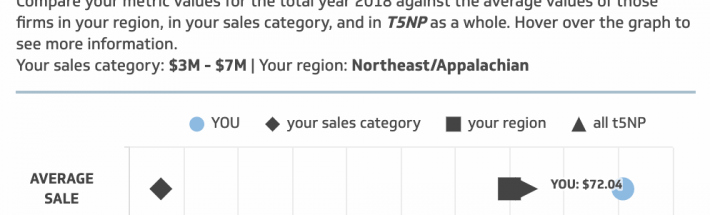
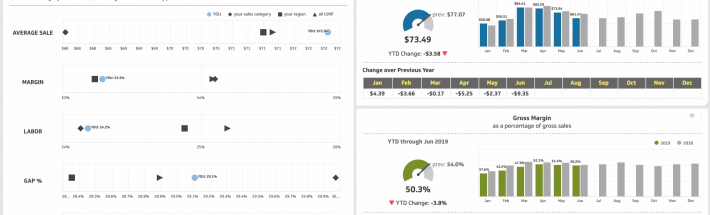
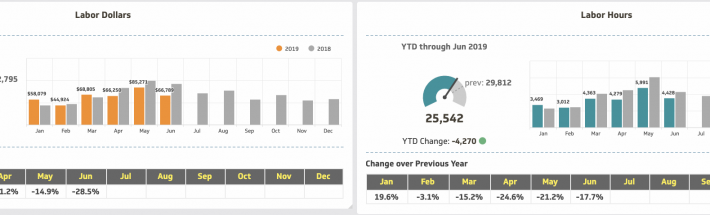
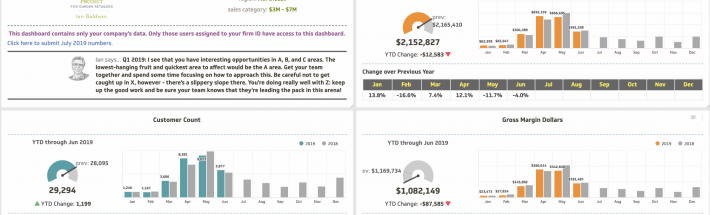
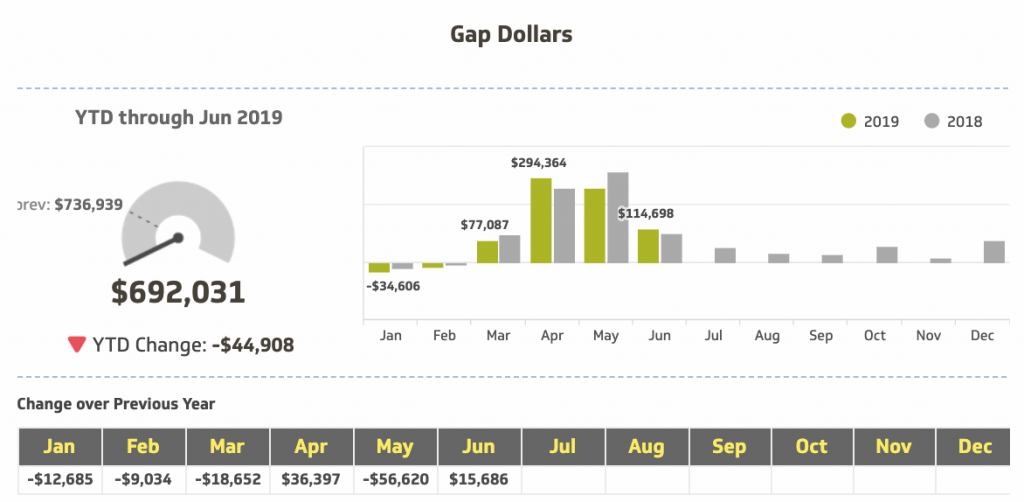
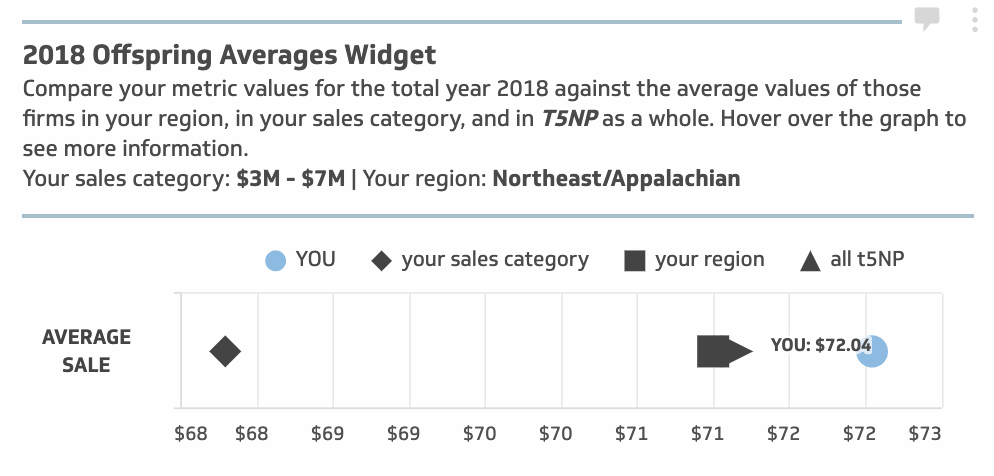
It’s all totally anonymous and participants can compare their 5 Key Performance Indicators, Sales Volume, Customer Count, Gross Margin, Labor Costs and Labor Hours with trends across the industry as a whole. They can also judge where they stand against others in such key profitability datapoints: Average Sale, “Gap” Dollars (Gross Margin less Labor Costs) and the all-important productivity number, Sales Dollars Per Labor Hour. Anonymous comparisons can be made with others in the same region, those with same retail sales volume, or with all participants in N. America. Each participating company also gets my personal analysis notes/suggestions as well as a host of extras such as webinars and takeaways for “Ten Minute Trainings”, team-goal setting and so on.

*sample Private Company view dashboard*

Interested in joining The 5 Numbers Project? The next subscription window is open now until Sept 21st.

So, What Have We Learned So Far – How IS The Industry
Doing?

2019 is looking like a “half-decent year” for many west
coast and mountain region Garden Centers with a so-so rating in the east and
south. There’s always “weather” in one area or another but shoppers were out in
droves this spring. I heard many “best day ever”, “biggest Friday sales ever”
or “weekdays were like weekends” type of comments, though again they tend to
refer to top-line sales not bottom-line profits. The biggest “I wish” I heard was
about getting (and keeping!) labor. There seems little or no consumer pushback
on increased prices (I hope you did raise prices!) this year.

Just as I can’t tell you which GC companies have joined the T5NP project, I hope you understand that it’s not fair to share the numbers with people or companies not (yet) in the program. However, with data from all of 2018 and most of 2019 now in the system I can share some very interesting questions arising, or things that might make you go Hmm….

Three BIG Hmms… From Just 5 numbers!

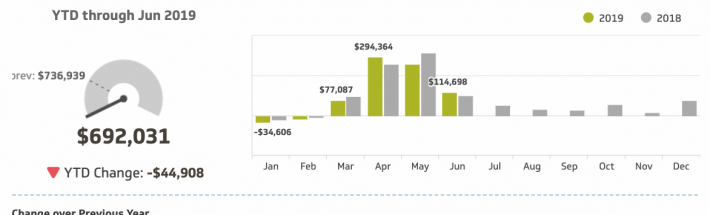
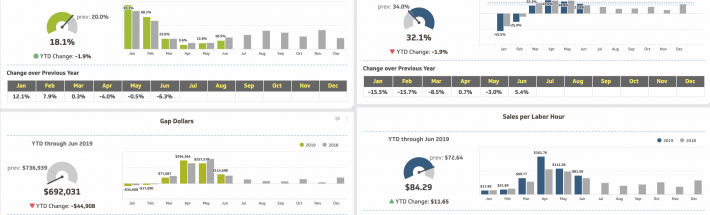
First up: At the Fall shows people will be asking each other “How did you do this year?” and they almost always reply with their top-line sales compared with last year. But our T5NP data shows that’s only a start: we look at the growth in G. Margin Dollars after the Labor costs are subtracted (that’s what we call “Gap” dollars). You can have a 10% rise in sales yet still be behind last year in the growth of “Gap” dollars (which is really the operational profit). So was your increase in Gross Margin dollars eaten up by the rise in overheads? All that spring activity and excitement but no increase in bottom line – that’s one BIG HMMM…!

Secondly: Average Sale Per Customer is not really a national number – it’s much more dependent on your inventory mix, big ticket departments, seasonality, etc – but if it is not increasing each year faster than the cost of doing business, you are dependent on finding new customers or tempting regulars to shop more often. And we all know how expensive and time-consuming that can be, Hmmm….

Third: Labor costs, people frequently ask me “What should my Labor % be, what are others doing?” but my answer has always been “It depends on your Gross Margin %”. Gross Margin dollars pay for everything after inventory (aka Cost of Goods) so your Gross Margin dollars (not GM %!) should be growing quicker than your Labor dollars – are they? Hmm….

So many questions from just 5 numbers … and now, The 5 Numbers Project is proud to be empowering companies with PERSONALIZED TOOLS to find answers: for only $1788 / year ($149 / month after onboarding), we are empowering teams to take action and drive REAL profitability to the bottom line.

New subscriptions to The 5 Numbers Project are now open through September 21. More details and a downloadable brochure on the project can be found at that link. We’d love for you to join us! What questions do you have that we can help answer?

Aug 13, 2019 Comments Off on We’re Measuring what Matters…
t5np8Nov2018

T5NP*: The Fifth Number – Labor Hours

This is one of those numbers that gets overlooked in the multi-tasking world that is garden retail, where selling products is the main goal. It’s just one more thing to think about and not one that appears to have an “A List” priority, there’s only so much time in a day….

But if you look at companies in construction, health care or other service industries where selling labor is their main goal, those labor hours are front and center in performance metrics.

In garden retail the labor topic usually focuses at the cost of that labor (our Fourth Number) … but now we extend the analysis and comparisons to the amount of that labor, which opens up a whole new business discussion: Productivity.

Happiness is… Rising Productivity

So far in this blog series, and in The 5 Numbers Project (or ‘T5NP‘ for short) we have been focused on Profitability (seeing if we are making more money than other companies, or more than we were making last year.) With this Fifth number, we are looking to see if we are making more money with LESS labor, the biggest single cost of running a retail store. If net profit (aka “bottom line”) rises at the same rate as the cost of doing business, owners and bankers should all be happy, correct?

Well actually no, not happy at all. You’ll hear the word “productivity” a lot from economists and stock analysts as they look for those companies doing more from less. This is often (but not always!) a sign of a progressive company or an economy that is investing in efficiency for the future, rather than living on the current methods or market. The efficiency of a garden retail company is no different. Unless the owners can be sure of being able to constantly raise prices to cover rising costs and make the same bottom line as previous years, they have to make more with less.

Hail to the “Offspring”!

I’m getting ahead of myself here, but the most basic measurement of productivity is one of our “offspring” calculations, called Sales per Labor Hour. (Subscribers to The 5 Numbers Project will spend a lot of time learning more about, working with, and comparing these offspring calculations.) This has nothing to do with the cost of those hours (see Labor Costs post) and has everything to do with the end product of all those hours used, the sales volume.

(Yes – The answers in general retail companies will be all over the map depending on the type of store and business model. Obviously, a warehouse club will have a huge Sales per Labor Hour metric compared to an urban boutique nursery. Even within full-service garden retail, a company that sells a lot of big ticket items like patio or specimen trees will have a much higher number than one that sells mostly small items like annuals or veggies.)

And while it’s fascinating to think about how you compare to others … the most important thing is how YOU are doing compared to yourself over time. Not just “May 2019 vs. May 2018” — but YTD 2019 vs. 2018. I firmly believe that measuring The 5 Numbers — and their “offspring” calculations – will help you have a better picture of your profitability.

What’s the POINT of all of this “T5NP”?

If you can MEASURE it, you can IMPROVE it.

That’s it, in a nutshell. Over the past 5 weeks, this blog has offered a (not-so) brief overview into the philosophy behind each of The 5 Numbers that our successful clients have been using for years to “beat the street.”

As you’ve already guessed — it’s these 5 Numbers:  Sales Volume, Customer Count, Gross Margin Dollars, Labor Dollars, and now Labor Hours form the foundation of our new national online benchmarking initiative for garden retail, launching this month.

A few quick details on the Project (you can learn more by clicking here too):

  • Subscriptions are available ONLY to garden retailers – but any retailer can join, regardless of any other peer/buying group affiliation. All welcome!
  • The data will be dynamically filterable by business size and geographic region – though your business NAME remains completely anonymous.
  • There’s an onboarding fee ($849) to build your private company dashboard with a year of historical data as your baseline) and then a monthly subscription fee ($149) to enable you to see your live comparisons – to yourself in the previous year, and to your peers.
  • This isn’t “just us” — this project is being managed by Your MarketMetrics (a team led by a familiar name to some from the old ANLA days – Kellee (Magee) O’Reilly.)  Your MarketMetrics launched a companion benchmarking initiative for nursery & greenhouse earlier this year, which is managed by Dr. Charlie Hall.

SO:  If you’re intrigued about how it works … and what you get when you subscribe, register to join us for a free preview webinar on FRIDAY December 7 at 3pm Eastern time (noon Pacific). The webinar will be recorded if you can’t join live, but you need to register to be able to view it.  CLICK HERE  to RSVP to attend the webinar, and take the first step toward more profitability with less stress … by tracking just 5 Numbers!

Nov 20, 2018 Comments Off on T5NP*: The Fifth Number – Labor Hours
t5np14Nov2018

T5NP*: Fourth Number – Labor Dollars

Between 65% and 80% of all the money that independent garden retailers receive as Sales Dollars is spent within the next few weeks or months on just two aspects of running the business: Inventory and Labor.  So yes: Labor Dollars is a BIG important number!

The range of labor costs as a percentage of sales in all types of retail can range from the low single digits of a warehouse “club” to the high 20%s, even the low 30%s in a lavishly, full service, up-scale store (the sort of place you have to ask them to let you in…). The range in a typical independent or local garden retailer can be from 15% of sales to the high 20s, depending on the service model and the competency of the management.

A Burden Or An Investment?

But as you’ve heard me say, dollars pay the bills, not percentages, so let’s look at what that means in real numbers. When we talk about the labor bill (and when we track it in the 5 Numbers Project), we are taking about the whole cost of labor, not just the wage the employee gets. The “human” costs of employing others (sometimes called “Burden”) are unknown to many employees. Well, unless someone told them, how would they know anyway? I didn’t when I was an employee.

This labor total includes the actual wage plus all payroll taxes and fees, plus the employer’s contributions to things like FICA, FUTA, Workman’s Comp, Health Insurance, Vacation Pay or PTO, training, conference travel and even uniforms. If it is part of having human beings working at your company, we include it. Depending on what state you operate in, this can add up to 30% or more to the hourly cost, making a $15 an hour employee cost the company more like $20. I just heard from a client this week that their health insurance alone now works out at an extra $3.50 an hour (but their poinsettia prices haven’t gone up in years…)

So the rise in labor dollars is something we are closely following, especially in a good economy when employees have some leverage to bargain with. Just from watching the trends of this one number, questions emerge: Is our rise in labor dollars more or less than our rise in what pays for it, i.e., Sales Dollars? Are Gross Margin dollars going up quicker than Labor Dollars and if not, how do we make that happen?

Making Informed Decisions

When Labor Dollars are a focus of management, buyers who discover that next “killer” item, can now ask themselves if the extra labor cost associated with this new product will negate all the extra margin dollars it could bring in. That’s a “hmmm…” factor. (It might also be a good negotiating point with the supplier!)

When you closely track your labor costs, it almost becomes second nature to think of the value of the task the team are currently doing. Are we matching employee costs to the value of the task? Do we have employees costing $24 an hour doing tasks that could be done by someone costing less, and if so – is there an employee growth opportunity? I know a manager who once calculated that, because of their disorganized receiving system, the labor cost of unloading a truck was about the same as the Gross Margin dollars in that load! (That’s an Arrrggghhh!)

So, as you can tell, we do watch all these numbers very closely. As Labor Dollars are the second biggest cost after Inventory (and exponentially more than the marketing budget!), we especially track the trends and changes in this one.

Click here to learn more about The 5 Numbers Project: a national initiative to create valuable benchmarking & visual dashboards that will increase profitability for independent garden centers. And stay tuned for the last of the 5 numbers – Labor Hours – next week.

Nov 14, 2018 Comments Off on T5NP*: Fourth Number – Labor Dollars
t5np8Nov2018

T5NP*: Third Number – Gross Margin Dollars (NOT GM Percentage!)

As you know already, the Gross Margin is the difference between the actual received price the retailer paid for an item and the actual sale amount received from the customer. It’s the sale of the goods, minus the cost of the goods (the “profit margin” on the sale).

As I have said before: many managers and owners track and discuss their sales dollars, but not that many would openly discuss their results in Gross Margin Dollars with other companies, even those a thousand miles away. Maybe that’s because this metric is indeed a measure of retail competence, such as negotiating the best delivered terms, understanding your market and the pricing strategies it responds to and so on. Many managers do track the GM percentage – but it’s GM dollars that pay the bills, so we see the more successful ones tracking both % and GM dollars – with actions and decisions based on the change in dollars not the percentage.

Core Values

Buying and selling is the core of retail. So the main result of that activity, GM dollars, is surely something to track and compare with previous years… and with one’s peers. Think of all the actions, tasks, decisions, follow-ups, administration, customer contacts, etc. carried out by the retail team each day that end up in the GM dollars column… From agreeing upon a delivered price with a supplier, to accurate receiving and pricing, through impulsive merchandising and signage, to accurate register skills and efficient delivery: company profitability is on the line.

The dollar difference between buying (inventory) costs and the final sales dollars, i.e. the “margin,” is what pays for everything else in the company and makes a profit to continue the company. This is the ONLY retail step that actually creates wealth, adds value. Some experts say that investing in inventory is the only creative investment that actually grows the company. All other activities and investments are just defensive to try to hold that wealth.

It’s such a basic concept that sometimes we almost forget. Every plant that dies or is discounted, every “incredible!” item brought in that is still sitting there being dusted and moved every season, every overlooked freight charge and every under-budgeted cost of that inventory, reduces those margin dollars. The difference between planned or budgeted GM percentage and the actual figure after inventory adjustments can be as much as 5-6% of total sales (twice the ad budget!). When you show that difference as actual margin dollars, you might want to sit down first.

Margin Matters

The GM dollars metric is an essential one for comparing the profit returned from the cost of goods invested in the various products and can be found with a click of your POS system under “GMROI”.

But until you know the growth or decline in GM dollars for the current year, you can’t (or shouldn’t) decide how much labor you can afford to bring in to service and sell the inventory next year. Unless you look at the trends in GM dollars in your company (and in the industry) you may not know which products are worth investing in and which are worth leaving alone.

So, yes Gross Margin dollars are something we are really going to get down to, watch like a hawk and talk about, a lot. Let’s talk about your GM dollar changes up or down within a department or a category. Let’s look at GM dollars for a certain category and then look at how much space or labor that category uses to get that result, hmmm… Let’s compare GM dollars earned from competing vendors (ooh, that’s powerful!) or from different buyers at their annual review time… Never a dull moment in the GM dollars world!

As retailing gets more and more competitive, the progressive garden retailers are constantly searching for best use of their inventory money to create the GM dollars, so going forward let’s focus on the only investment that creates wealth – who’s in?

*T5NP is The 5 Numbers Project: a new national benchmarking initiative for independent garden retailers. Subscriptions are open to ANY garden retailer, regardless of other buying/peer group or membership affiliations. Available now through December 23, 2018: learn more by clicking here. 

Nov 8, 2018 Comments Off on T5NP*: Third Number – Gross Margin Dollars (NOT GM Percentage!)
t5np21Oct18

T5NP*: Second Number – Customer Count

(We say “Customer Count”- aka Register Rings, Tickets, Baskets or Checkouts)

I am always a little surprised at the number of owners and managers who DON’T track or even think about this metric. Surely just from a Return on Investment in marketing aspect it should be one to watch. Savvy operators are currently using this metric trend to see what effect the switch from traditional media marketing to social media marketing is having on the number of shoppers coming in the door.

The number of customers who volunteer to spend their precious time and money at your store is first and foremost a reaction to the company’s value proposition. It’s the public’s response to your marketing, promotions, reputation, drive-by appeal or their previous shopping experience. It’s the public’s “secret shopper” report – every day.

Just for starters, a history of customer count by the hour is very useful for team scheduling so you don’t have 5 employees gathered round the register at 8.00am, but only two out selling in the after-school rush at 4pm!

Context Is Necessary

Customer count is influenced by outside events or circumstances and any record of it must also have a note of the business conditions in that time period. If it rained heavily this week last year or there was a major ball game on TV that weekend last year, managers should know before they react to the number.

We are always cautious about comparing one day, week or even a months’ data in this metric so we look for trends in the customer count more than specifics. I’ve seen too many owners stress out on a couple of lower-than-expected days or weeks. The sky is probably not about to fall if customer count is down 10% in a specific spring. That’s why we will be building anonymous regional groups in The 5 Numbers Project so you can see if your customer Count IS 10% down when your local peers are all up. (Then there’s a reason for a ‘hmmmm’….!)

Interesting, But Now What?

If customer count is going down, it might mean a marketing challenge to recapture lost traffic or stimulate new shoppers to try your offer. In that case budgets should be geared to boosting external messages, marketing, image, exterior remodeling, building community relations and so on.

If customer count is going up, you may have a sales and merchandising challenge serving and inspiring all those extra people to spend while in your store. In this case, budgets should invest in more internal resources for improved hiring, training, buying, merchandising, silent selling and just generally helping customers spend more.

Just think, so many significant management decisions from one little number! (That’s another Hmmm….!)

Next week, we’ll tackle the third of The 5 Numbers as we gear up to open subscriptions in the Project (*T5NP) … stay tuned!


Oct 31, 2018 Comments Off on T5NP*: Second Number – Customer Count