and now, with 2 years of data, we can share some “hmmmmm” questions!
You may have noticed that I was offline here for a bit, while you all were off having Spring! We were working on The 5 Numbers Project (T5NP), a new national platform for anonymous online sharing and comparing of garden retail performance numbers.
In the first enrollment period (pre-Spring ’19), we had 51 GC companies in 22 states and 3 Canadian provinces, with total retail sales over $310 million, join the program. On the Grower side of the industry, Dr Charlie Hall has now been operating a similar program (with different metrics) for two years, so our retail participants can also get his key takeaways in our online “Insights Library”. Finally, the garden business is getting a national independent retail database – long overdue! This represents REAL DATA on which to make profitability comparisons, investment or borrowing decisions, goal setting or even to “sell up and relax”!
How Does it Work?
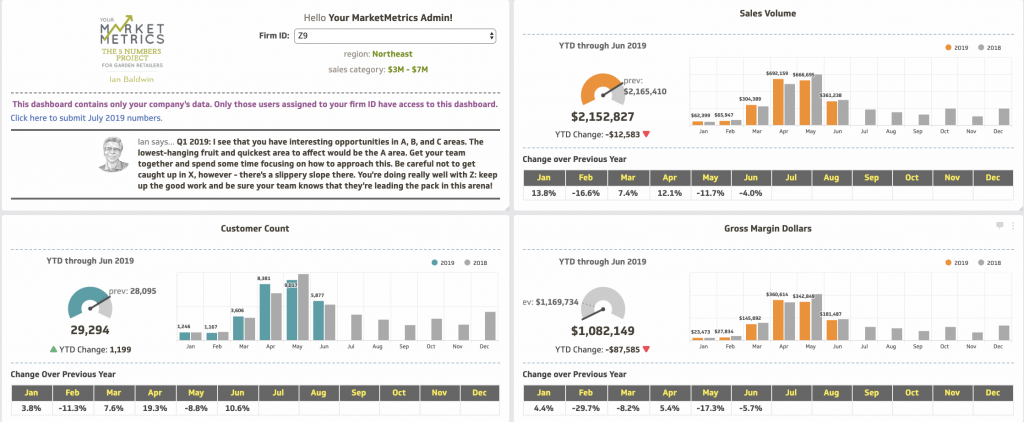
T5NP participants submit just the 5 numbers that matter, every month, through a secure online portal and the “magic software” does the rest. It’s almost two programs in one: At any time GC owners and key team players such as managers or buyers can view the company’s own Private dashboard comparing this year’s profitability performance with last year’s. Secondly they can use the group Comparison or Trend dashboards to see how their business is trending YTD or through all last year with the other GCs.
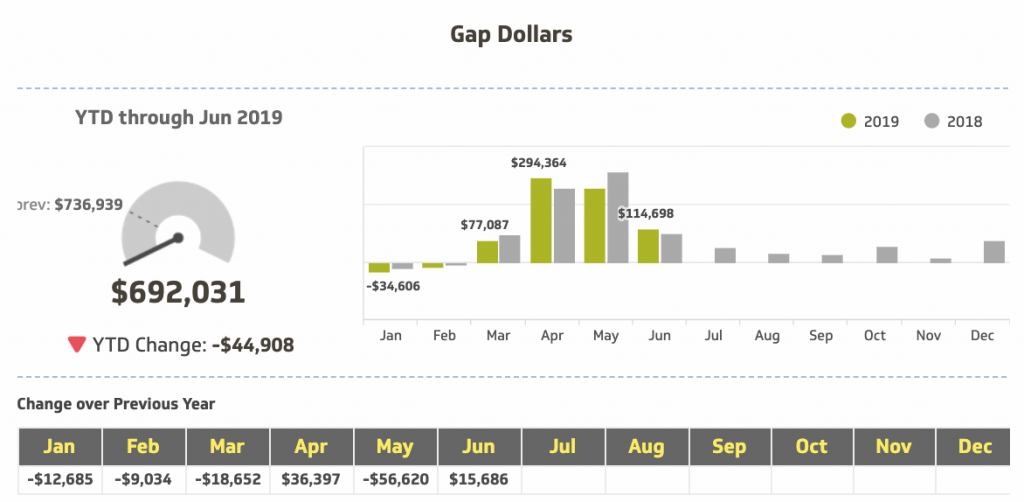
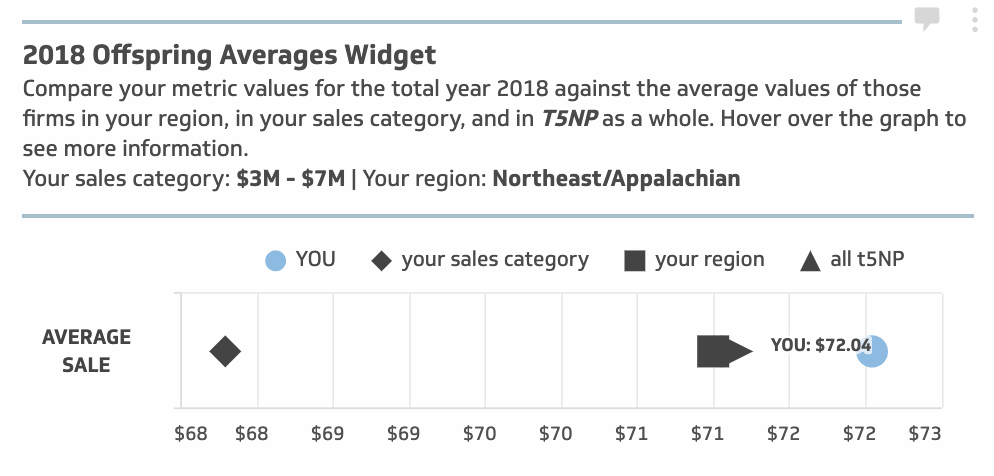
It’s all totally anonymous and participants can compare their 5 Key Performance Indicators, Sales Volume, Customer Count, Gross Margin, Labor Costs and Labor Hours with trends across the industry as a whole. They can also judge where they stand against others in such key profitability datapoints: Average Sale, “Gap” Dollars (Gross Margin less Labor Costs) and the all-important productivity number, Sales Dollars Per Labor Hour. Anonymous comparisons can be made with others in the same region, those with same retail sales volume, or with all participants in N. America. Each participating company also gets my personal analysis notes/suggestions as well as a host of extras such as webinars and takeaways for “Ten Minute Trainings”, team-goal setting and so on.

So, What Have We Learned So Far – How IS The Industry
Doing?
2019 is looking like a “half-decent year” for many west
coast and mountain region Garden Centers with a so-so rating in the east and
south. There’s always “weather” in one area or another but shoppers were out in
droves this spring. I heard many “best day ever”, “biggest Friday sales ever”
or “weekdays were like weekends” type of comments, though again they tend to
refer to top-line sales not bottom-line profits. The biggest “I wish” I heard was
about getting (and keeping!) labor. There seems little or no consumer pushback
on increased prices (I hope you did raise prices!) this year.
Just as I can’t tell you which GC companies have joined the T5NP project, I hope you understand that it’s not fair to share the numbers with people or companies not (yet) in the program. However, with data from all of 2018 and most of 2019 now in the system I can share some very interesting questions arising, or things that might make you go Hmm….
Three BIG Hmms… From Just 5 numbers!
First up: At the Fall shows people will be asking each other “How did you do this year?” and they almost always reply with their top-line sales compared with last year. But our T5NP data shows that’s only a start: we look at the growth in G. Margin Dollars after the Labor costs are subtracted (that’s what we call “Gap” dollars). You can have a 10% rise in sales yet still be behind last year in the growth of “Gap” dollars (which is really the operational profit). So was your increase in Gross Margin dollars eaten up by the rise in overheads? All that spring activity and excitement but no increase in bottom line – that’s one BIG HMMM…!

Secondly: Average Sale Per Customer is not really a national number – it’s much more dependent on your inventory mix, big ticket departments, seasonality, etc – but if it is not increasing each year faster than the cost of doing business, you are dependent on finding new customers or tempting regulars to shop more often. And we all know how expensive and time-consuming that can be, Hmmm….

Third: Labor costs, people frequently ask me “What should my Labor % be, what are others doing?” but my answer has always been “It depends on your Gross Margin %”. Gross Margin dollars pay for everything after inventory (aka Cost of Goods) so your Gross Margin dollars (not GM %!) should be growing quicker than your Labor dollars – are they? Hmm….
So many questions from just 5 numbers … and now, The 5 Numbers Project is proud to be empowering companies with PERSONALIZED TOOLS to find answers: for only $1788 / year ($149 / month after onboarding), we are empowering teams to take action and drive REAL profitability to the bottom line.
New subscriptions to The 5 Numbers Project are now open through September 21. More details and a downloadable brochure on the project can be found at that link. We’d love for you to join us! What questions do you have that we can help answer?


Recent Comments